Why AI observability is more than application monitoring
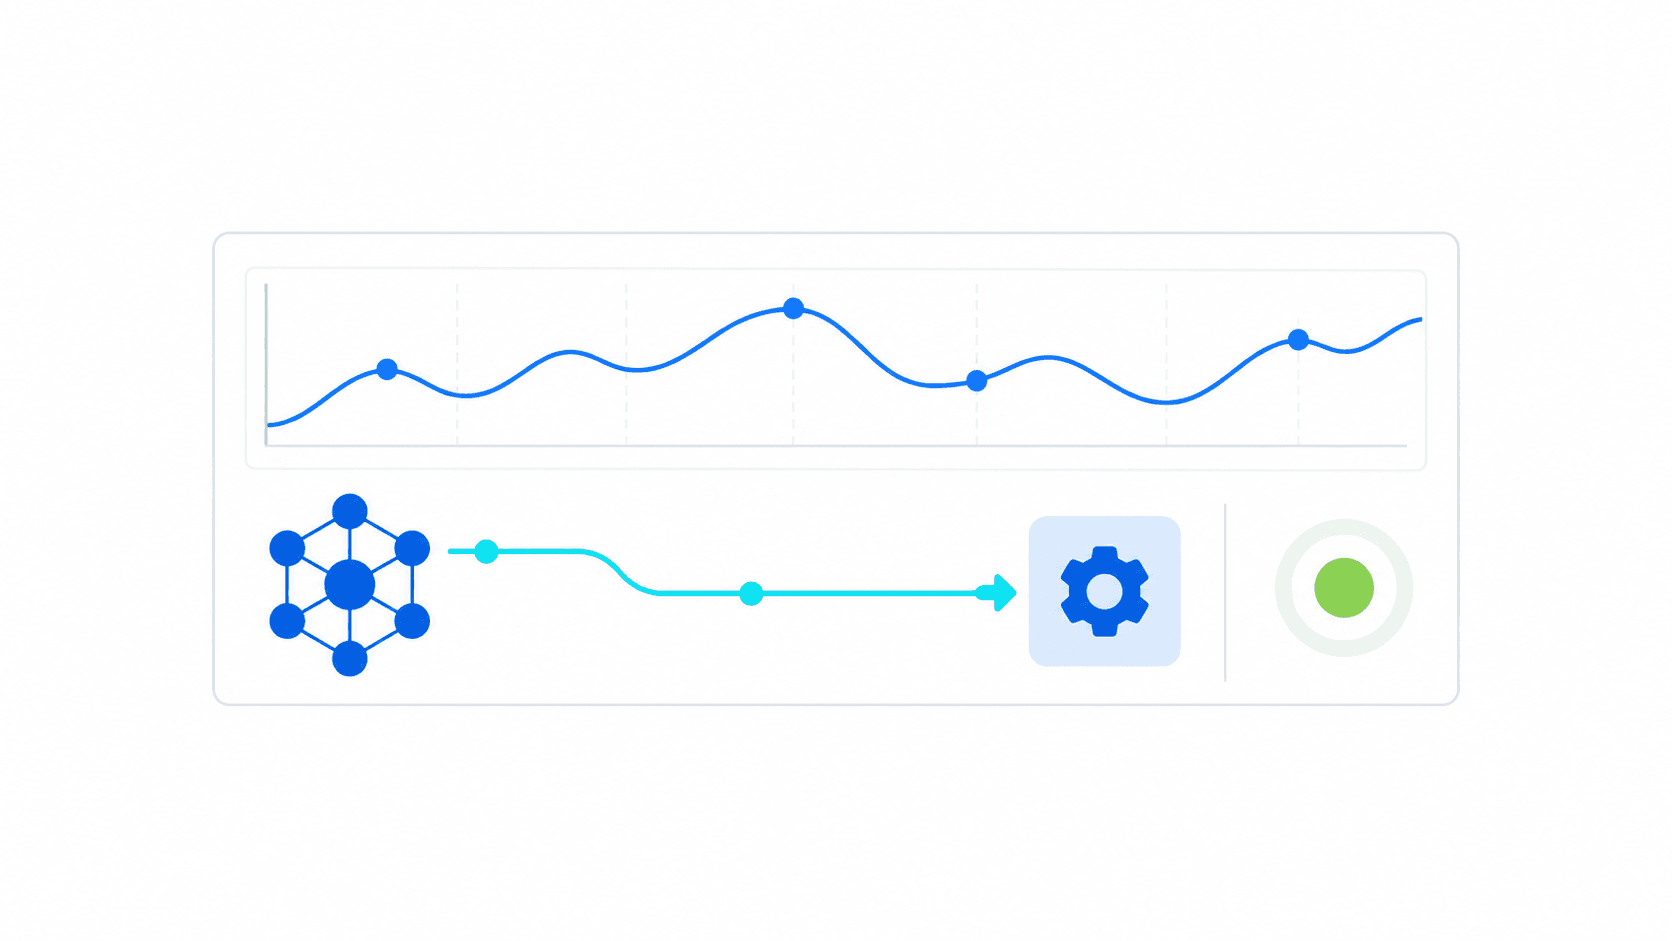
AI observability must show more than a conventional service dashboard that an endpoint is healthy, fast, and returning HTTP 200 responses. Teams need to know whether a generated answer uses the right source, an agent chose the correct tool, and the user’s task was completed. Observability connects system health to model behavior and real workflow outcomes.
Production AI is a chain of components: user interface, orchestration, retrieval, model provider, tools, policy checks, and downstream systems. A failure at any point can appear to users as a wrong answer or incomplete action. LLM observability gives engineers a way to follow that chain, while operational owners need summaries that explain frequency, severity, affected users, and business impact.
The signals to monitor
Start with a trace for each meaningful request. Capture the request identifier, workflow version, model and prompt version, retrieval sources, tool calls, policy decisions, timings, retries, and final state. Traces help developers find where behavior changed. Logging full prompts and responses may expose personal, commercial, or regulated information, so classify fields, redact or omit sensitive data, restrict access, and define retention before enabling detailed capture.
Pair traces with four groups of metrics. Reliability includes availability, errors, timeouts, and retry rates. Performance includes end-to-end latency and component latency, including percentiles rather than averages alone. Cost includes model usage and infrastructure per workflow, customer, or team. Quality includes task completion, citation or source correctness, policy adherence, human correction, and escalation. Select only the measures relevant to the use case and make their definitions explicit.
A practical AI observability implementation
1. Establish a baseline before launch. Record the current process’s completion rate, cycle time, rework, cost, and service quality. Define what a good outcome means with process owners. Without a baseline, teams can report model activity but cannot reliably show that AI has improved the work.
2. Instrument the end-to-end path. Use consistent request and trace identifiers to connect application events, retrieval, model calls, tools, and downstream writes. Record versions and relevant configuration changes. Capture the minimum information needed to diagnose issues, and never treat user content as ordinary diagnostic data by default.
Explore: AI security and operations services
Evaluate quality without pretending it is one number
3. Build an evaluation set from representative, permissioned examples. Include common requests, ambiguous cases, out-of-scope questions, stale sources, prompt injection, tool failures, and sensitive situations. Have subject-matter reviewers define acceptable outcomes and failure severity. Automated evaluation can help triage large volumes, but it should be checked against human judgment, especially when the consequence of an error is high.
4. Combine offline tests with production signals. A curated evaluation set detects regressions before release; user feedback and sampled human review reveal issues in real conditions. Measure different dimensions separately: factual support, relevance, completeness, tone when appropriate, correct tool use, and policy compliance. A single “quality score” can hide an increase in a rare but serious failure mode.
Detect drift and set meaningful alerts
5. Monitor for change in both inputs and outcomes. User intent, source documents, product policies, model behavior, traffic mix, and connected tools all evolve. Track shifts in retrieval coverage, no-answer rates, correction rates, task completion, and cost. A model may remain unchanged while the system’s effective behavior changes because a knowledge source became stale or a workflow integration changed.
6. Alert on actionable conditions, not every fluctuation. Set thresholds according to baseline variability, risk, and service expectations. Route technical incidents to platform owners and quality issues to the business owner who can judge impact. Include a runbook: how to investigate the trace, pause a capability, roll back a version, switch to a fallback, or notify users. Alerts without clear ownership become background noise.
Use traces to diagnose agent workflows
AI agent monitoring needs visibility into decisions and actions, not just model calls. Record which tools were available, which were selected, whether authorization succeeded, what result was returned, and whether a human approval was requested. Monitor for repeated tool loops, excessive retries, unusual access patterns, partial completion, and actions that do not match the user’s request. This lets the team diagnose orchestration failures as well as model response problems.
Keep records useful without turning them into an uncontrolled surveillance system. Establish purpose limitation, access roles, retention, and review procedures. Where a trace contains personal data, use privacy engineering and applicable legal review. If full content is not needed to diagnose a failure, retain structured metadata or a redacted sample instead. Observability should strengthen accountability while respecting the people whose work passes through the system.
Explore: AI technology capabilities
Plan for AI observability in 2027
A reasonable 2027 planning outlook is for observability to move from optional developer tooling toward a standard part of AI service operations. As organizations operate more models, agents, retrieval systems, and third-party tools, they will need consistent traces, cost attribution, evaluation, access records, and incident processes. This is an outlook based on current platform and standards activity, not a guaranteed market outcome; teams should choose capabilities against their own risks and architecture.
Interoperability will matter. Prefer instrumentation that can preserve useful context across model providers and orchestration frameworks, and avoid coupling critical evidence to one vendor’s dashboard when portability is important. Agree on a small internal schema for workflow ID, version, actor, model, tool, outcome, latency, and error class. Consistent event meaning makes it easier to compare services and investigate incidents across teams.
Connect monitoring to governance and improvement
NIST describes its AI Risk Management Framework as a voluntary resource for incorporating trustworthiness into AI design, development, use, and evaluation. It is not a substitute for legal advice or sector-specific obligations, but its lifecycle perspective reinforces a useful operating principle: monitoring should feed decisions about risk, improvement, and accountability. Keep a system inventory, identify owners, document intended use, and review performance and incidents over time.
FIX Intelligence, part of FIX Solutions JSC, helps organizations design AI-enabled architecture, build evaluation and monitoring plans, and operate production workflows. Begin with a limited set of signals tied to user and business outcomes. Add depth when a real operational question requires it; a small dashboard teams trust is more useful than a wall of metrics nobody owns.